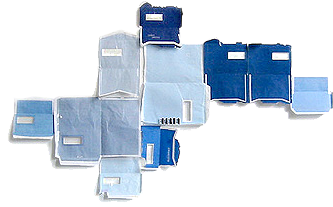
The Voronoi Diagram was codified by the Ukrainian/Russian Mathematician Georgy Voronoi in the early 20th century. It is a method of subdividing space based on a set of input points. The Voronoi diagram can be used to describe almost literally anything – from microscopic organisms to cell phone networks, and it exists at every scale, from cosmic foam to quantum foam. This series is concerned with attempting to draw the Voronoi diagram, usually generated with a computer algorithm, by hand, starting from a number of everyday situations.
Found on ske765book’s Flickr photostream.
His website.
His work on a Baltimore Artist’s Awards site.

How to [here]:

More Voronoi Diagrams here (portraits) and here (magnetic)
See also Romanian surrealist Dolfi Trost‘s entopic graphomania:

From A Journey Round My Skull (where there are 8 more of these illustrations):
Richard Shillitoe describes “entopic graphomania” on his Ithell Colquhoun website :
A method developed by the surrealists in Bucharest, in which a dot is made at the site of each impurity or difference in colour in a blank sheet of paper, and then lines are drawn between the dots. The connections may be by curved lines or (Colquhoun’s preference) straight lines only. This leads, in Colquhoun’s own words, to “the most austere kind of geometric abstraction.” The word “entoptic” derives from the Greek word meaning “within vision.” It refers to images that arise from within the optical system rather than from the outside world (for example, the common experience of floaters in the eye). Strictly speaking, therefore, the name is a misnomer. Despite her comments about favouring straight lines, only one such example, an untitled pencil drawing published in Athene is currently known. Torn Veil, a graphomania dating from 1947 incorporates shading that softens the austerity and develops the image.

